Article
The information superhighway
All big cities have one thing in common – traffic. It’s frustrating, costly and bad for the environment. High levels of traffic increase stress, lower quality of life and make a city less appealing. Traffic engineers are charged with making transportation systems run as efficiently as possible, but often the task seems impossible. However, with technological innovations and sophisticated data analytics, local governments are better able to battle gridlock now than ever before.
 Los Angeles’ Nerve Center
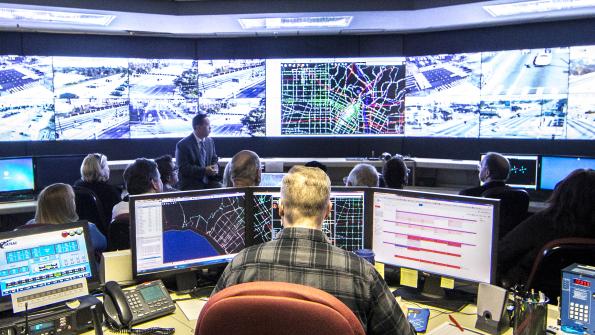
The Los Angeles Department of Transportation began development of their Automated Traffic Surveillance and Control system (ATSAC) over 30 years ago for the 1984 Summer Olympics. Small in scope, the system integrated about 20 intersections, says Edward Yu, a Los Angeles traffic engineer and the ATSAC system’s manager. In the decades since, it has grown to cover the entire city, synchronizing all of Los Angeles’ 4,600 traffic signals – the first major city in the world to do so.
The massive system works by allowing total control of every signal in the city. “We’ve hardwired every signal in the city of Los Angeles,” Yu says. “Keep in mind the city of Los Angeles is about 460 square miles, and encompasses about 7,000 miles of public streets. We cover a large area.”
To control traffic on such a large scale, the system is broken up into several sectors, each consisting of about 200-300 signals each, Yu says. Each sector is hardwired to a local hub, and from that hub data is transmitted via fiber optic cable back to the traffic management center, located near city hall.
“From there we get second-by-second data from each signal,” Yu says. “We get data regarding how much time was given to a particular [traffic signal] phase, we’ll get data on how many cars went through, we can get data in some instances on how fast that vehicle was moving, we get data on congestion levels… we get data on how the overall intersection is performing.”
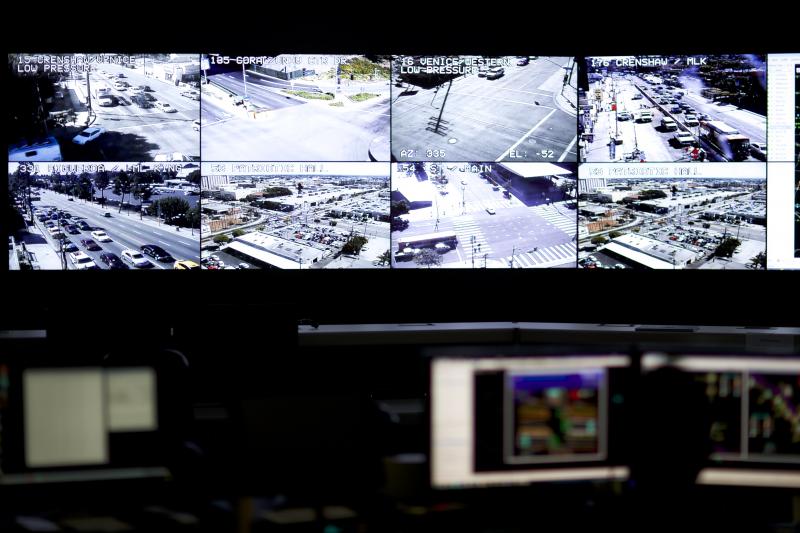
While the center does utilize video surveillance cameras set up at intersections, the data is mostly gathered by over 40,000 magnetic induction loops buried under the pavement. These sensors detect the vehicles that pass over them, feeding the information back to the traffic management center. “Those are our eyes out in the street,” Yu says.
With this data, the system can automatically respond to fluctuations in traffic patterns, making adjustments to signal timing to optimize the throughput of the overall street system. The system is managed holistically and as a network, with the timing at one signal impacting others in the system. Real-time data is gathered and analyzed at a network-wide level, ensuring the entire system is running as efficiently as possible.
“The system was developed in such a way that synchronization and coordination is a key element,” Yu says, “but it’s really our ability to optimize the conditions of the signals that allows us to really manage traffic… to optimize everything that comes through the signal.”
Additionally, signals can be manually adjusted if need be. “We can manually manipulate the timing for each intersection,” Yu says, “which allows us to manage more effectively and efficiently during special events, construction events, emergency activities… which helps us keep everything moving in the city of LA.”
Analyzing the demands of the entire street system in real time is ATSAC’s primary objective. “Through the use of these loop detectors we’re able to respond to the demands of vehicular traffic,” Yu says. “We’re measuring the demands of traffic and the system is automatically adjusting to those demands in such a way where we improve the efficiency of the intersections for all modes of transportation.”
It’s important to note, Yu says, that the system doesn’t only monitor passenger vehicle traffic. “The system has expanded and evolved into not only management of vehicles; we’re kind of a multimodal system now,” Yu says. “We manage busses, we manage trains, we manage pedestrian activity, we manage bicycle activity, we manage in some cases equestrian activity all with one system.”
One of the elements that sets ATSAC apart from other adaptive traffic management solutions in other cities is that the system was developed entirely in-house, Yu says. “We developed our own algorithms, we developed our own system, because traffic and how it’s managed is unique in LA.” As such, Yu says, several cities across the country have come to LA for advice on how to develop their own, similar systems or modify already existing ones.
The system cost about $400 million spread out over its 30-year development, Yu says, but he says it has been worth the cost. According to a study conducted by the Texas A&M Transportation Institute, the ATSAC system successfully reduced travel delays, increased overall speeds and has cut down greenhouse gas emissions in the city.
According to the report: “We can expect ATSAC corridors… to improve speeds by 13 percent and decrease average stopped delay for heavier flows along the arterial[s] by 32 to 43 percent. ATSAC may also reduce the total delay, fuel consumption and emissions (CO, NOx, VOC) by 3 to 4 percent.”
Due to the successful evolution of the ATSAC system and the increasingly sophisticated ways data can be collected and analyzed, Yu feels that the ATSAC system, and others like it, will be integral in the development of Los Angeles’ future. “The use of data, providing people with information so they can make smarter choices, that’s the future,” he says.
 Boston’s Data-Sharing Partnership
Instead of constructing their own system from the ground up, Boston’s traffic management practices rely on partnerships with third-party private businesses to collect, share and analyze data to make the city’s transportation networks run more efficiently.
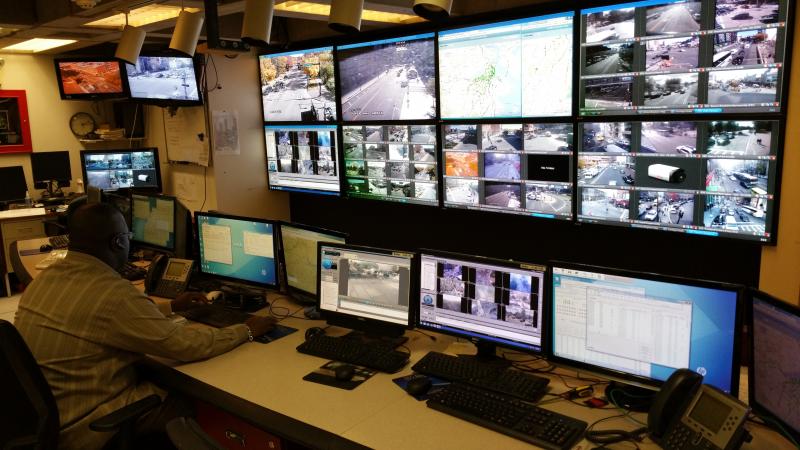
Gina Fiandaca, the Boston Transportation Department commissioner, says the city’s traffic management center partnered with Waze, a community-based traffic navigation app, to be alerted to traffic jams, accidents or any other disruptions in the normal flow of traffic. Waze users report these interruptions, and the app forwards data to the city’s traffic engineers who, using their own data gathered from sensors and cameras, can make real-time adjustments to traffic signals.
“We have 850 signalized intersections,” Fiandaca says, “and over 550 of those are connected to our traffic management center. We have a staff of engineers that monitor the roadways and are able to make those adjustments.”
While the data provided by Waze helps these engineers make informed decisions, the partnership is a two-way street, Fiandaca says. “We also provide information back to Waze on changes that we’ve made in real-time, but also any known changes that we have coming up that are planned.” She says this helps Waze and its users in the Boston area – some 400,000 individuals – plan trips based off the most up-to-date information possible. “It’s very helpful to us to be able to get our message out to such a wide volume of users out on the roadway.”
However, partnering with a third-party organization presents some challenges, especially when it comes to sharing data. Infrastructure and software must be compatible across agencies, and ensuring this compatibility is often frustrating and time consuming. In this regard, Fiandaca says it’s important to have highly skilled, technically minded individuals on staff.
“We were fortunate that we have some really sharp, technical people in the Department of Innovation and Technology,” Fiandaca says. “They were able to facilitate this [partnership] for our engineers at the management center as well as our enforcement officers.” It was important, logistically speaking, that the incoming data translate into the already existing system, and any outgoing data be made anonymous, she adds.
The successful partnership with Waze has spurred other programs, Fiandaca says. “We asked ourselves, ‘What else could we use the Waze data for?’” The answer was to combat one of the most irritating traffic impediments on narrow urban streets – double-parking.
The city plotted where the highest number of double-parking offenses occurred, based off the number of citations generated on particular streets, and deployed bicycle officers to these locations. Armed with real-time data of slowing traffic conditions based off Waze data, officers could see when an individual had double-parked and issue that driver a citation.
“It’s been pretty successful. We could see that our bicycle patrols were actually not issuing as many tickets.” This demonstrated, Fiandaca says, that the data-driven double parking patrols were becoming a deterrent to the practice on the streets where double-parking was most likely to occur. “We consider that a success of the partnership with Waze,” she adds.
The agreement between the city and Waze was brokered by Boston’s Department of Innovation and Technology, Fiandaca says, and the Transportation Department is just one of several city departments benefiting from data-sharing. And this partnership has been useful in many other ways.
Another challenge that has been helped through data-sharing practices is centered around the ongoing Casey Overpass Project, a four-lane divided parkway in the Jamaica Plain neighborhood, that needs to be removed.
“We knew that [the removal] would present a challenge for not only the city of Boston but other municipal and state agencies that were involved in usage of that roadway,” Fiandaca say. “We were able to take the Waze reports and plot when we’d be likely to see traffic jams around that construction area and make changes to MBTA (Massachusetts Bay Transportation Authority) schedules and to crosswalks, because some of the delays were being caused by pedestrian activity.”
She adds that as the project progressed, data analytics have been integral in the traffic management center’s strategy in developing mitigation techniques, from traffic signal timing to the deployment of traffic enforcement officers. By analyzing the data around the worksite, the city’s engineers can develop an informed and realistic plan to keep traffic flowing as efficiently as possible.
Looking into Boston’s future, Fiandaca says data analytics will be important in realizing the mayor’s goal of becoming a Vision Zero City – with a primary objective of eliminating pedestrian fatalities at intersections. “We will be taking a data-driven approach to our intersection management [to achieve this goal], Fiandaca says. “We’ll use data from our EMS systems, from Boston police and the Transportation Department to design safer intersections.”
“I think data analytics will continue to be critically important as we manage our transportation system,” Fiandaca concludes. “Rapid dissemination of highly accurate information will be critically important.”
 Houston’s Cost-Effective Solution
In 1996, Houston was looking for a way to monitor traffic on its highways. At that time, the most reasonable solution was to monitor vehicles’ RFID toll tags. Houston has an extensive system of toll roads, and the saturation of tags in the field made for a reliable data set. Measuring how long it took for one tag to travel between two points gave the city’s engineers a decent idea of how quickly traffic was flowing.
However, to scale the system up was quite an expensive proposition. Jeffrey Weatherford, Houston’s Traffic Operations Division’s deputy director, says the city was looking at about $90,000 per scanner location. “When you start figuring that the city of Houston runs over 640 square miles and 16,000 lane-miles… It very quickly becomes cost prohibitive.”
Another solution the city considered was to employ license plate readers. These readers, Weatherford says, have a variety of applications and could be used across departments, but again, at $50,000 per location, the costs were simply too high.
“So we kept looking,” Weatherford says. By partnering with the Texas A+M Transportation Institute, a workable solution came to light. “They were doing research projects on border crossings for pedestrians using Bluetooth,” he says. While working with the Institute, the city came up with the idea that this technology could possibly be adapted to calculate travel times for vehicles.
The city started tests in 2009, and saw successes almost immediately. The data collected was rich and actionable, and the costs per site were drastically lower than previous options – about $1,000 to $1,500 per site. The initial test area covered about 60 square miles on the west side of town and involved about 250 signalized intersections, according to Weatherford. “We used that to refine our processes and figure out how to make the system work.” By 2011, the full system was up and running in Houston.
“What we found was that the data collected was very similar to the data collected from the toll tag readers and other devices,” Weatherford says. “We’ve since had a project where we expanded [the system] to a total of 650 locations – that project’s still underway.” Weatherford estimates that by next year Bluetooth readers will cover all of the city’s major corridors.
The system works by harvesting the Bluetooth signals originating from the devices drivers are carrying with them, such as laptops, cellphones and hands-free devices. Newer vehicles may also have Bluetooth connectivity integrated into their navigation or stereo systems. Specific signals are isolated and timed from one point to another, and the vehicle’s speed is determined. By performing this process in rapid succession throughout the course of the day, a complete picture of the city’s traffic patterns emerges.
One issue, Weatherford says, is that one vehicle may be putting off more than one Bluetooth signal at a time. “One problem we get into is, OK, my car has a Bluetooth signal, my phone has a Bluetooth signal, and I may have another device in the car that has one,” he says. “I may have three or four devices that have all got Bluetooth signals going out that we’re picking up.”
The solution for this problem is by carefully crafting analytical tools to throw out meaningless data the redundancies can create, while holding on to and measuring the good data. These carefully calibrated tools have given Houston the ability to be highly accurate in their representations of traffic, as opposed to other systems such as Google Maps.
“[The traffic data] we have in our system may differ from what Google may have,” says Weatherford, “but we’ve found through travel time studies that ours tends to more accurately reflect what was happening at that time.”
Although the system has been hugely successful, there were some privacy concerns surrounding its implementation. There were echoes of 1984 when the city announced it would be gathering data from privately held devices en masse. However, Weatherford says these concerns were quieted through public information campaigns, which detailed the extensive measures the city took to ensure data remain anonymous.
A typical Bluetooth address is a combination of a dozen numerals and letters; the city only reads six. “It’s really not trackable back to any individual device,” Weatherford says. What’s more, the entire system was built to forget its own records. “When you pass by point A, we collect your data. When you pass by point B, we do the match, figure the time and we automatically drop the data from point A,” he adds.
For those still concerned about their privacy, there’s another simple way to completely opt out of the system, Weatherford says, by simply turning off the Bluetooth connectivity while driving.
In general, Weatherford says that eventually data analytics will make driving much safer – both in Houston and across the nation. As technology advances, and vehicles become more connected to one another as well as with their surrounding infrastructure, human error factors are going to become negligible. Red light running will become a thing of the past, and “Who knows? We may not even have traffic signals in the future. It may just be cars talking to cars and cars talking to roads.” He adds, “From a traffic safety standpoint, to me, where we end up in the future is just fascinating.”
_____________
To get connected and stay up-to-date with similar content from American City & County:
Like us on Facebook
Follow us on Twitter
Watch us on Youtube