https://www.americancityandcounty.com/wp-content/themes/acc_child/assets/images/logo/footer-logo.png
  • Home
  • Co-op Solutions
  • Hybrid Work
  • Commentaries
  • News
  • In-Depth
  • Multimedia
    • Back
    • Podcast
    • Latest videos
    • Product Guides
  • Resources & Events
    • Back
    • Resources
    • Webinars
    • White Papers
    • IWCE 2022
    • How to Contribute
    • Municipal Cost Index – Archive
    • Equipment Watch Page
    • American City & County Awards
  • About Us
    • Back
    • About Us
    • Contact Us
    • Advertise
    • Cookie Policy
    • Privacy Statement
    • Terms of Service
American City and County
  • NEWSLETTER
  • Home
  • Co-op Solutions
  • Hybrid Work
  • Commentaries
  • News
  • In-Depth
  • Multimedia
    • Back
    • Podcasts
    • Latest videos
    • Product Guides
  • Resources/Events
    • Back
    • Webinars
    • White Papers/eBooks
    • IWCE 2022
    • How to Contribute
    • American City & County Awards
    • Municipal Cost Index
    • Equipment Watch Page
  • About Us
    • Back
    • About Us
    • Contact Us
    • Advertise
    • Cookie Policy
    • Privacy Stament
    • Terms of Service
  • newsletter
  • Administration
  • Economy & Finance
  • Procurement
  • Public Safety
  • Public Works & Utilities
  • Smart Cities & Technology
  • Magazine
acc.com

Public Safety


USGS

Article

From emergency response to strategic planning: A Kilauea case study

From emergency response to strategic planning: A Kilauea case study

  • Written by Joel Burroughs
  • 29th August 2022

When volcanoes erupt, the force of explosions and lava dramatically change the landscape, impacting the geography and the lives of those who live and work nearby. This is especially true on the southern tip of Hawaii, which is home to the world’s most active volcano, Kilauea.

Responding to Kilauea’s 2018 eruptions, federal, state and local organizations swung into action to evacuate and protect residents across an almost 14 square mile area that was covered by lava. One interagency group—which included the U.S. Geological Survey (USGS) Hawaiian Volcano Observatory (HVO), U.S. Army Corps of Engineers (USACE), Federal Emergency Management Agency (FEMA) and the state of Hawaii—teamed up to monitor geographic changes and assess damage during the volcano’s four-month active period, as well as gather more information afterwards to help first responders and scientists model and predict future activity for the enhanced safety of residents.

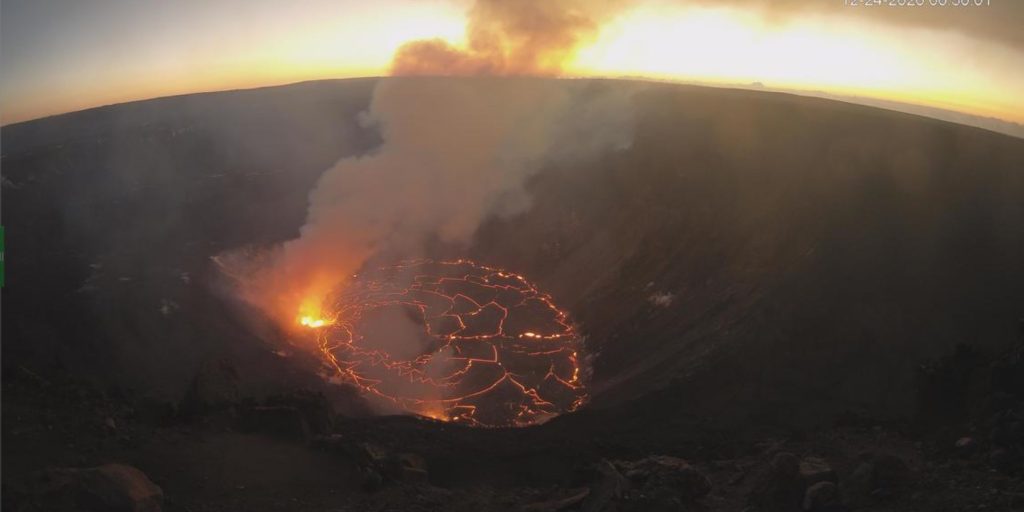
Flying into an active volcano
In May 2018 lava erupted from two dozen vents around Kilauea, filling Kapoho Bay and extending new land nearly a mile into the sea. Destructive rivers of molten rock consumed Hawaii’s largest natural freshwater lake and covered substantial sections of residential communities.

First responders, as well as local, state and federal agencies, had to quickly figure out the risk to surrounding areas, then evacuate residents and prevent people from going into areas that could be threatened by lava flows. While first responders worked on the ground, the HVO pulled together a team including NV5 Geospatial and GEO1 (now a division of NV5 Geospatial) in a groundbreaking partnership to document an active volcano and assess the situation from above.

Chronicling the landscape impact of an active volcano required innovative use of both existing and new technologies. Airborne remote sensing was the only way to acquire the data safely and economically while calderas were erupting and lava was flowing. In coordination with the National Park Service, our partners at the HVO, local agencies and air traffic controllers, our team flew 11 missions in six days, collecting lidar and imagery over 57 square miles, including the Halema‛uma‛u crater, middle East Rift Zone, and lower East Rift Zone and Pu’Ū ’Ō’Ō lava flow field.

Using a helicopter equipped with a state-of-the-art multi-sensor package—dual Riegl VUX-1 LR lidar sensors co-housed with Phase One iXM RGB and NIR 100MP and Oblique RGB cameras—we had the flexibility and agility required to collect data at a low altitude (500 feet above ground level) under persistent cloud cover. Careful planning ensured that we could collect high density lidar (40-80 pulse/m2) and imagery, while also allowing for real-time adaptations in flight height to avoid lava vents, gas clouds and debris.

Because rapid turnaround of information was critical for real-time response to the eruption, NV5G processed the data within 10 hours of each mission while onsite, then worked with USACE, which provided automated cloud point processing and generated a digital elevation model (DEM) within another 10 hours for immediate analysis by the USGS, HVO and others. With this data in hand, first responders and scientists got unique insights into the rapidly changing conditions to help assess damage and gain key insights into the changes happening.

Establishing a baseline for the future
In 2019, our team joined forces again for a data collection that spanned 219 square miles around Kilauea, nearly four times the size of the survey area the year before. The goal for this project was to document the post-eruption landscape. From there, we’d develop a baseline model that would help predict the geography and topography of future lava flows for the enhanced preparedness and safety of residents.

Once again, we leveraged the latest technology, deploying a unique sensor configuration package to enable increased point density (up to 100 pulses/m2 compared to 40-80 pulses/m2 in 2018), which provided greater detail and accuracy. The customized multi-sensor package included the Riegl VQ-480II (a lightweight sensor with drone capability) with an integrated Phase One IXU RS-1000 4-band camera.

During this project we also conducted a ground survey to determine absolute accuracy, and georeferenced and rectified imagery to new lidar data. From there, we provided our partners and other agencies with a classified point cloud in LAS v1.4, bare earth DEM, intensity images, orthorectified 4-band imagery and metadata.

Comparing data and imagery collected during the 2018 eruption and 2019 baseline program to data collected in 2011 yielded interesting results. We quantified large topographic shifts, finding that some areas had shifted 1.5 meters to the east, 2 meters to the north, and a full 1 meter in elevation in just seven years. Such changes could have a significant impact on structural stability of homes, utility infrastructure and surrounding vegetation, impacting safety of residents. These findings were then confirmed by HVO scientists.

And during our 2019 flights, the GEO1 crew discovered a 10-foot body of water inside the Halema’uma’u Crater—something that had not been observed before. Over time, the pond grew to a depth of 60 feet and spanned more than 600 feet. Between December 2020 and May 2021, the water boiled off and was replaced with a lava lake that was about 700 feet deep. These observations prompted researchers to investigate the volcano’s water table and prepare for the possibility of steam-driven explosions in the future.

Collaborative partnership improves public safety
The collaborative partnership between the HVO, USACE, FEMA, the state of Hawaii, NV5 Geospatial and GEO1 showcased the innovative use of geospatial technology to study active volcanos and improve public safety. The high-profile nature of the 2018 eruption and quick response of the team shone a spotlight on the value of remote sensing, using state-of-the-art lidar and imagery, to support natural disaster response and monitoring. And by collecting even more detailed data post-eruption, we were able to show the impact on the landscape and human infrastructure, providing scientists, first responders, and state and local agencies with valuable insights to predict future lava flow paths that will inform hazard planning and public safety initiatives.

Joel Burroughs, program manager for NV5 Geospatial, has more than 16 years of experience with project management in the federal practice area, with additional experience in energy, transportation, and state and local arenas for contracts ranging in scale from small mapping projects to large regional and statewide programs.


Editor’s Note: How prepared is your community for a weather/natural disaster? Please take the American City & County Natural Disaster Preparedness survey and let us know!


Tags: homepage-featured-1 homepage-featured-2 homepage-featured-3 homepage-featured-4 Public Safety Public Works & Utilities Commentaries Public Safety Public Works & Utilities Article

Most Recent


  • New York mayor announces city-wide curbside composting program, impacting 8.5 million residents by 2024
    On the heels of a successful 3-month-long pilot program in Queens, New York City has announced the largest curbside composting program in the United States. The initiative will begin following a winter-long hiatus of the Queens pilot, which is set to return permanently March 27. Curbside service to Brooklyn will begin Oct. 2, followed by the […]
  • Phoenix
    Federal funds help fast-growing Arizona city address several infrastructure challenges and needs
    Joe Giudice, public works director for the city of Phoenix, says the influx of new residents is driving a lot of construction in his community. “Phoenix is the fifth largest city in the United States. It is one of the fastest growing cities in a fast-growing region, which influences infrastructure product and service demand. This […]
  • ARPA funds
    Spending American Rescue Plan Act funds: A primer for municipalities
    The American Rescue Plan Act (ARPA) of 2021 is a $1.9 trillion legislative package that includes funding for states, local governments and tribal nations to respond to the economic and public health impacts of the COVID-19 pandemic. While initially restricted, subsequent guidance from the federal government has expanded what those funds can be used for. […]
  • landslides
    Managing landslides along road corridors using remote sensing
    Maintaining roads is an optimization problem. Local officials must balance limited and sometimes shrinking budgets with the needs of their communities to have safe and reliable transportation systems. Unfortunately, the importance of a particular maintenance issue is often judged based on anecdotal information and complaints from the public rather than hard data. This approach is […]

Leave a comment Cancel reply

-or-

Log in with your American City and County account

Alternatively, post a comment by completing the form below:

Your email address will not be published. Required fields are marked *

Related Content

  • From emergency response to strategic planning: A Kilauea case study
    Taking a comprehensive approach to handling disasters

White papers


Modernizing government services for today’s resident expectations

24th January 2023

Preparing Your Community Now for the Next Generation of Older Adults

18th October 2022

Helping Government Fleets Achieve Their Goals

30th September 2022
view all

Webinars


How To: Evaluate Digital Government Service Delivery Technologies

23rd January 2023

Using Technology to Enhance Communications

29th November 2022

Learn the benefits of transforming and automating your Contract Management process

4th November 2022
view all

PODCAST


Young Leaders Episode 4 – Cyril Jefferson – City Councilman, High Point, North Carolina

13th October 2020

Young Leaders Episode 3 – Shannon Hardin – City Council President, Columbus, Ohio

27th July 2020

Young Leaders Episode 2 – Christian Williams – Development Services Planner, Goodyear, Ariz.

1st July 2020
view all

GALLERIES


Report: While remote work is causing offices to empty out, walkable cities are still in high demand

26th January 2023

10 American cities with a great downtown

24th January 2023

Miami leads the way in FT-Nikkei ranking of best U.S. cities for foreign companies

20th January 2023
view all

Twitter


AmerCityCounty

Report: With increase popularity of e-bikes and e-scooters, there’s a need for ‘safe and connected infrastructure’ dlvr.it/ShlKmJ

31st January 2023
AmerCityCounty

New York mayor announces city-wide curbside composting program, impacting 8.5 million residents by 2024 dlvr.it/ShhRk1

30th January 2023
AmerCityCounty

Federal funds help fast-growing Arizona city address several infrastructure challenges and needs dlvr.it/ShhBtf

30th January 2023
AmerCityCounty

How 5G is making cities safer, smarter, and more efficient dlvr.it/ShYNcx

27th January 2023
AmerCityCounty

Shifting city demographics present an opportunity to build coalitions, address inequality dlvr.it/ShYMMm

27th January 2023
AmerCityCounty

Spending American Rescue Plan Act funds: A primer for municipalities dlvr.it/ShXzvl

27th January 2023
AmerCityCounty

Report: While remote work is causing offices to empty out, walkable cities are still in high demand dlvr.it/ShVhBW

26th January 2023
AmerCityCounty

Managing landslides along road corridors using remote sensing dlvr.it/ShTpL6

26th January 2023

Newsletters

Sign up for American City & County’s newsletters to receive regular news and information updates about local governments.

Resale Insights Dashboard

The Resale Insights Dashboard provides model-level data for the entire used equipment market to help you save time and money.

Municipal Cost Index

Updated monthly since 1978, our exclusive Municipal Cost Index shows the effects of inflation on the cost of providing municipal services

Media Kit and Advertising

Want to reach our digital audience? Learn more here.

DISCOVER MORE FROM INFORMA TECH

  • IWCE’s Urgent Communications
  • IWCE Expo

WORKING WITH US

  • About Us
  • Contact Us

FOLLOW American City and County ON SOCIAL

  • Privacy
  • CCPA: “Do Not Sell My Data”
  • Cookie Policy
  • Terms
Copyright © 2023 Informa PLC. Informa PLC is registered in England and Wales with company number 8860726 whose registered and Head office is 5 Howick Place, London, SW1P 1WG.