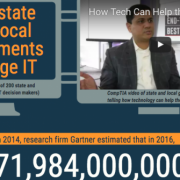
Inforgraphic Infographic: How state and local governments manage IT 22nd November 2016 State and local governments were expected to spend over $71 billion on IT in 2016, and many reported sharing similar challenges, priorities and viewpoints.
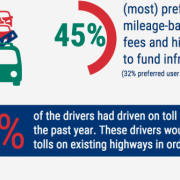
Inforgraphic Infographic: What drivers think about tolls 19th September 2016 Americans support tolls when they’re used to directly fund infrastructure projects and when they help drivers avoid traffic and save time. Learn more about public perception on tolling by viewing this infographic.
Young Leaders Episode 4 – Cyril Jefferson – City Councilman, High Point, North Carolina 13th October 2020
Young Leaders Episode 2 – Christian Williams – Development Services Planner, Goodyear, Ariz. 1st July 2020
Report: Local and state governments are facing a retention crisis; the worst could be yet to come dlvr.it/SSnmS7 24th June 2022
Amid an unprecedented increase in federal spending, cities and counties stand to benefit from partnerships dlvr.it/SSkGBn 23rd June 2022
Governments using technology to harness data and improve decision-making dlvr.it/SSk3H0 23rd June 2022
Infrastructure highlighted by city leaders as top priority in analysis of 60 mayoral addresses dlvr.it/SSgBck 22nd June 2022
Oklahoma City puts the focus on employees when implementing changes in office technology dlvr.it/SSfyns 22nd June 2022
We want to hear from you! Please take this brief survey and let us know how your organization is managing your budg… twitter.com/i/web/status/1… 22nd June 2022
Buying smart solutions: Technology is now part of (almost) every government purchase dlvr.it/SSbj3Z 21st June 2022
Amid tech labor shortage, outsourcing digital services could provide relief dlvr.it/SSbj23 21st June 2022